Bên dưới đây mình có spoil trước 1 phần nội dung của cuốn sách với mục tiêu là để bạn tham khảo và tìm hiểu trước về nội dung của cuốn sách. Để xem được toàn bộ nội dung của cuốn sách này thì bạn hãy nhấn vào nút “Tải sách PDF ngay” ở bên trên để tải được cuốn sách bản full có tiếng Việt hoàn toàn MIỄN PHÍ nhé!


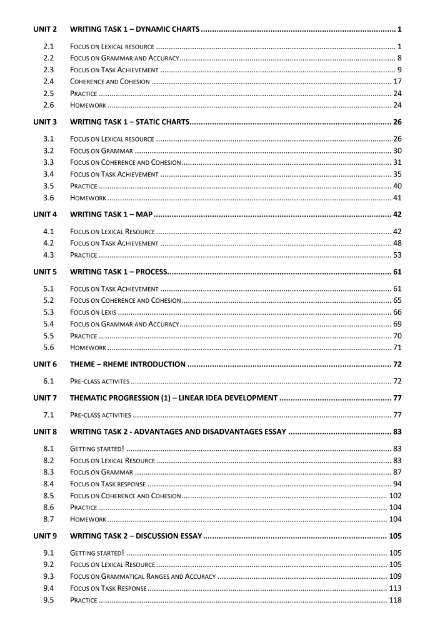
Mục lục** UNIT 2 WRITING TASK 1 – DYNAMIC CHARTS…………… 1 2.1 Focus on Lexical Resource……………………………………………………… 8 2.2 Focus on Grammar and Accuracy……………………………………………. 9 2.3 Focus on Task Achievement………………………………………………….. 17 2.4 Coherence and Cohesion………………………………………………………. 24 2.5 Practice………………………………………………………………………………. 24 2.6 Homework…………………………………………………………………………… 24 UNIT 3 WRITING TASK 1 – STATIC CHARTS……………………………………………. 26 3.1 Focus on Lexical Resource…………………………………………………….. 30 3.2 Focus on Grammar……………………………………………………………….. 32 3.3 Focus on Coherence and Cohesion………………………………………… 31 3.4 Focus on Task Achievement………………………………………………….. 35 3.5 Practice………………………………………………………………………………. 40 3.6 Homework…………………………………………………………………………… 41 UNIT 4 WRITING TASK 1 – MAP……………………………………………………………. 42 4.1 Focus on Lexical Resource…………………………………………………….. 42 4.2 Focus on Task Achievement………………………………………………….. 48 4.3 Practice………………………………………………………………………………. 53 UNIT 5 WRITING TASK 1 – PROCESS………………………………………………………. 61 5.1 Focus on Task Achievement………………………………………………….. 61 5.2 Focus on Coherence and Cohesion………………………………………… 65 5.3 Focus on Lexis…………………………………………………………………….. 66 5.4 Focus on Grammar and Accuracy………………………………………….. 69 5.5 Practice………………………………………………………………………………. 70 5.6 Homework…………………………………………………………………………… 71 UNIT 6 THEME – RHEME INTRODUCTION……………………………………………. 72 6.1 Pre-class Activities………………………………………………………………… 72 UNIT 7 THEMATIC PROGRESSION (1) – LINEAR IDEA DEVELOPMENT…….. 77 7.1 Pre-class Activities………………………………………………………………… 77 UNIT 8 WRITING TASK 2 – ADVANTAGES AND DISADVANTAGES ESSAY……. 83 8.1 Getting Started…………………………………………………………………….. 83 8.2 Focus on Lexical Resource…………………………………………………….. 83 8.3 Focus on Grammar……………………………………………………………….. 87 8.4 Focus on Task Response……………………………………………………….. 94 8.5 Focus on Coherence and Cohesion………………………………………… 102 8.6 Practice………………………………………………………………………………. 104 8.7 Homework…………………………………………………………………………… 105 UNIT 9 WRITING TASK 2 – DISCUSSION ESSAY…………………………………….. 105 9.1 Getting Started…………………………………………………………………….. 105 9.2 Focus on Lexical Resource…………………………………………………….. 109 9.3 Focus on Grammatical Ranges and Accuracy………………………….. 113 9.4 Focus on Task Response……………………………………………………….. 118 9.5 Practice………………………………………………………………………………. 118 —
2.1.5 Language of estimation **STRUCTURE 1:** The prediction/expectation/projection/forecast/anticipations/likelihood + shows/reveals/indicates/is that there will be a dramatic increase in the number of car users. The anticipation shows/reveals/indicates/is that there will be an increase in the price of food from 20 dollars in 2005 to 25 dollars in 2025. The forecast shows/reveals/indicates/is that the price of food will undergo/witness/experience an increase from 20 dollars in 2005 to 25 dollars in 2025. **STRUCTURE 2:** It is predicted/expected/projected/estimated/anticipated/forecast/likely that the number of car users will increase dramatically. It is predicted/expected/anticipated/forecast/estimated that the price of food will increase from 20 dollars in 2005 to 25 dollars in 2025. It is predicted/expected/anticipated/forecast/estimated that the price of food will undergo/witness/experience an increase from 20 dollars in 2005 to 25 dollars in 2025. **STRUCTURE 3:** The number of car users are predicted/expected/projected/estimated/ anticipated/forecast to increase dramatically. The price of food is predicted/expected/anticipated/forecast/estimated to decline from 20 dollars in 2000 to 10 dollars in 2025. The price of food is predicted/expected/anticipated/forecast/estimated to experience a decline from 20 dollars in 2000 to 10 dollars in 2025. Exercise 2 Use the expression below to fill the blanks in the following Task 1 response. | 1. it was still at this point | 6. it dropped to | | :—————————- | :——————————– | | 2. dropped even further | 7. down to | | 3. this number steadily increased | 8. a slight recovery back to | | 4. dropping from | 9. gradually slipped in numbers |
5. numbers were on the decline again 10. up to [Graph: TYPES OF INSURANCE] (Graph showing three lines: blue for Private coverage, orange for Public coverage, grey for Uninsured. The Y-axis is labeled “EMPLOYEES” from 0 to 60. The X-axis is labeled “YEARS” with ticks at 1998, 2000, 2002, 2004, 2006, 2008. Private coverage starts around 50 in 1998, dips to around 40 in 2002, rises to around 45 in 2004, and ends around 35 in 2008. Public coverage starts around 25 in 1998, rises steadily to around 30 in 2000, 35 in 2002, 40 in 2004, and around 50 in 2008. Uninsured starts around 22 in 1998, drops to around 20 in 2000, 17 in 2002, 15 in 2004, and around 17 in 2006 and 2008.) The given graph compares the number workers in a specific company who had either public or private health insurance or were not insured at all. The period surveyed covers the years between 1998 and 2008. Overall, this graph shows that the numbers of employees on private insurance and without insurance were going down, while public health coverage was becoming the preferred option for most workers. In 1998, 50 employees had private coverage, making it the most common type of coverage, but (1) ______ 48 in 2000 and then (2) ______ to 40 in 2002. Despite (3) ______ 44 staff members in 2004, in 2006, (4) ______ and by the end of the period only 35 employees had this type of health insurance. Moving on to public health insurance, there were 25 employees with this type of coverage in 1998, though (5) ______ 2002 and then 40 in 2006, and in 2008, 50 employees had it. Meanwhile, those uninsured (7) ______ 22 in 1998 (9) ______ 16 in 2004, and (10) ______ four years later at the end of the data.
**2.2 Focus on Grammar and Accuracy** **2.2.1 Complex sentence** Theo tiêu chí chấm điểm Grammatical range and accuracy dành cho bài thi viết IELTS thì bạn phải viết chính xác và sử dụng đa dạng các câu ngữ pháp. Đặc biệt, bài viết sẽ được điểm cao nếu bạn dùng câu phức hay và phù hợp khi trình bày, so sánh các số liệu trên biểu đồ. **Exercise 3** Take the following short and simple sentences and rewrite them, joining them together one complex sentence. **Simple Sentences:** 1. According to the third pie graph, certain data was shown. 2. 28% of French women preferred to shop online. 3. A much larger 56% responded differently. 4. They tended to do their grocery shopping in large supermarkets. **Complex Sentence:** According to the third pie graph, although 28% of French women preferred to shop online, a much larger 56% responded that they tended to do their grocery shopping in large supermarkets. **a. Simple Sentences** The highest portion of smokers are men in their forties at 16% Men in their thirties and twenties account for 12% and 15% respectively. → The highest _______________ while **b. Simple sentences:** The chart also indicates other things University students tended to drink more than others. → The chart also indicates _______________ as _______________ — Cohesion refers to how everything fits together nicely. In other words, how you link your ideas together in sentences, between sentences, in paragraphs and the whole essay. In other words, it refers to the many ways (grammatical, lexical, semantic, metrical, alliterative) in which the elements of a text are linked together (Source: Faculty of English – University of Cambridge). Coherence refers to how if everything you have put together is understandable. In other words, do the things you are trying to say to me make sense, do I understand them? Cohesion differs from coherence in that a text can be internally cohesive but be incoherent – that is, make no sense. Here is a text that is grammatically and lexically cohesive, but not very coherent (Source: Faculty of English – University of Cambridge). An octopus is an air-filled curtain with seven heads and three spike-filled fingers, which poke in frills and furls at ribbon-strewn buttons. **2.4.1 Coherence – Organisational features** The key to effective coherence is planning – spending a few minutes planning your IELTS writing carefully. Let’s see how we can organise our task 1 reports and divide information into logical and coherent paragraphs. **2.4.1.1 Divide by period** One of the most popular methods of body structure is time division. For this method, we again have two more minor ways. **a. Divide the chart by first year and last year** This method applies to dynamic charts with four or more chart elements. Why is this the case? Because only when we have four chart elements will each paragraph of the body have enough data to write. For these charts, in paragraph 1 we will report and describe the figures for the first year. Then, in paragraph 2 we will describe and compare the trend in the changes of these statistical figures describe the ranking order of the first-year figures in paragraph no. 1. This means that we will focus on describing the chart elements, which elements are at the top, which are at the lowest, which are 2nd and 3rd. Besides, we also need to mention the difference in data between the chart elements. In the second paragraph, we must focus on describing the changing trends of these data up to the last year. This is where we need to write statistics are trending up and vice versa. put relevant topped the list/chart in terms of the number of automobiles sold in 1995 (180000 cars), followed by the United States of America with around 150000 units. In terms of the remaining countries, Vietnamese statistics did not record any car sale in 1995, whilst Thailand saw tiny sales of more than 10,000 automobiles. Despite first place in 1995, Swiss automobile sales experienced a clear year-on-year decrease afterwards to around 20000 units in 2015. The US automobile sales, although reported an increase to a high of 180000 in 2010, generally experienced a drop to 120000 in 2015. Nevertheless, there were upward trends in the number of cars sold each year in Vietnam and Thailand as the figures ended up at 160000 and 150000 units respectively. **b. Divide the chart into 2 halves** For charts with only 3 lines or less, spending a paragraph just writing 2 or 3 figures in the first year does not guarantee a sufficient word count. So, for these graphs, if we want to apply time division, we have to divide the graph into two halves. Write half of the graph in each paragraph. **Exercise 10** The graph below shows the proportion of the population aged 65 and over between 1940 and 2040 in three different countries. **2.4.1.2 Divide according to the similarity of each group of objects** This division will put a cold emphasis on recognizing the similarity in the trend of the chart elements. This means that IELTS test takers have to find out which components have the same uptrend and which components have the same downtrend. If in the case there are 2 increasing components, 1 decreasing component and 1 stationary component, then please group 2 increasing subjects into 1 paragraph, and the remaining paragraph will be of the other 2. **2.4.2 Cohesion – the problems of cohesive devices** Cohesive devices tell the reader what we are doing in a sentence and help to guide them through our writing. They signal to the reader what the relationships are between the different clauses, sentences and paragraphs. The biggest mistakes many students make is to use cohesive devices in nearly every sentence. If you look at the IELTS Writing Marking Criteria it states that a Band 7 ‘uses a range of cohesive devices appropriately although there may be some under-/over-


