Bên dưới đây mình có spoil trước 1 phần nội dung của cuốn sách với mục tiêu là để bạn tham khảo và tìm hiểu trước về nội dung của cuốn sách. Để xem được toàn bộ nội dung của cuốn sách này thì bạn hãy nhấn vào nút “Tải sách PDF ngay” ở bên trên để tải được cuốn sách bản full có tiếng Việt hoàn toàn MIỄN PHÍ nhé!


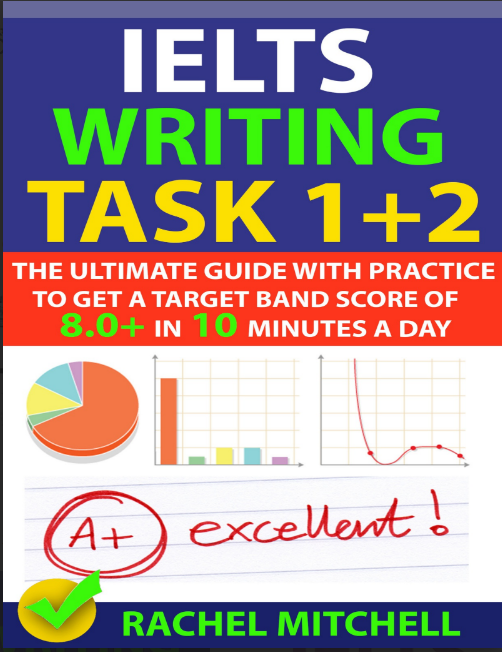
**INTRODUCTION** Thank you and congratulate you for downloading the book “IELTS Academic Writing Task 1 + 2: The Ultimate Guide with Practice to Get a Target Band Score of 8.0+ In 10 Minutes a Day.” This book is well designed and written by an experienced native teacher from the USA who has been teaching IELTS for over 10 years. She really is the expert in training IELTS for students at each level. In this book, she will provide you all proven formulas, tips, strategies, explanations, structures, task 1 + task 2 language, vocabulary, reports and model essays to help you easily achieve an 8.0+ in the IELTS Writing section, even if your English is not excellent. This book will also walk you through step-by-step on how to develop your well-organised answers for the Task 1 + Task 2 Writing; clearly explains the different types of questions that are asked for Task 1 + Task 2; provide you step-by-step instructions on how to write each type of report and essay excellently. As the author of this book, Rachel Mitchell believes that this book will be an indispensable reference and trusted guide for you who may want to maximize your band score in IELTS Academic Task 1 + Task 2 Writing. Once you read this book, I guarantee you that you will have learned an extraordinarily wide range of useful, and practical IELTS WRITNG strategies and formulas that will help you become a successful IELTS taker as well as you will even become a successful English user in work and in life within a short period of time only. Take action today and start getting better scores tomorrow! Thank you again for purchasing this book, and I hope you enjoy it. **IELTS WRITING INTRODUCTION** The IELTS Academic Writing lasts for 60 minutes (an hour). In the 1 hour, you have to complete 2 tasks, task 1 is a report, and task 2 is an essay. It is suggested that you should spend about 20 minutes on task 1 and about 40 minutes on task 2. In the IELTS Academic Writing task 1, you are required to write at least 150 words (10 to 15 sentences) and 220 words maximum. On the other hand, in the IELTS Academic Writing task 2, you are required to write at least 250 words (20 to 25 sentences) and 300 words maximum. Writing task 1 accounts for 1/3 while writing task 2 accounts for 2/3 of your total writing score. In the IELTS Writing test, you need to use academic language. It’s not informal language (it’s not an email to your friend). We need to use academic language.
**IELTS WRITING TASK 1** What are they asking you to do in a report? They’re asking you to describe the main points of the diagram. When I say “describe”, I mean you will tell them what the diagram looks like? For example, I have a diagram that shows fast food consumption, I simply need to describe that fast food consumption has increased/ has grown/ has risen; I don’t need to say “fast food consumption has risen because fast food is delicious and affordable”. No, you don’t need to explain, ok?. Explaining is what you are going to do essays in task 2 writing. Therefore, in task 1 writing, your job is to describe the main points of a diagram. What is a diagram? You might be asking. That’s a good question. These are all examples of diagrams. Diagrams are pictures that convey information, usually numbers. This is a type of a diagram called **flow chart**, and a flow chart shows us how to do something, a method to do something. [Image of a flow chart] Here, this is a type of a diagram called line chart or a line graph. It shows changes over time/ over a period of time. All right, when it comes to task 1 writing, there are a few rules you need to pay attention to. First of all, task 1 requires **150 words minimum**. If you write fewer than 150 words, you’re going to face a penalty. Therefore, you should try to write at least 150 words. I will tell you that it will be difficult for you to get a high score if you’re only writing 150 words. You probably will need to write 200 or 210 words to get a high score (7.5 – 8.0). For task 2 writing, it’s larger. It needs **250 words minimum**, and the essay is worth 2/3 of your score. It’s worth twice of task 1. Therefore, I would like to tell you that you should write task 2 first and spend 40 minutes on it. Now, we will focus on task 1 writing, we will be describing different kinds of diagrams. How are they marking you? How are they assessing you? How are they giving you a score in task 1 writing? Let’s look at the IELTS writing task 1 band score descriptors below: [Table of IELTS Writing Task 1 Band Descriptors]
you use, and how varied, accurate and appropriate you are with your vocabulary. Spelling errors will hurt your score, misusing word forms will hurt your score. If you say “sales increasing”, it’s wrong. Instead, you must say “sales increased”. **4. Grammatical range and accuracy:** obviously this means “are you making grammar mistakes?”, and “are you using complex sentence structures?” If you’re just doing the same sentence structure over and over, “sales increased”, then “sales fluctuated” and then “sales plummeted”. Ok, your grammar is accurate, but all you’re giving me is just past tense, past tense, and past tense. So you will get a good score for being accurate, but you will get a low score for using the same structure over and over. What you should be doing in task 1 is you should practice regularly. 7.0 – 8.0 for task 1 writing is very achievable because the language you use for task 1 writing is very narrow, and very limited. You don’t need to use a huge range of language. IELTS is a game after all. It is a test does exactly a game. It is a system for gaining points and losing points, and there are some rules to test. Therefore, we need to be sure we understand the rules so that we can avoid the penalty. In order for us to describe diagrams, I would say grammar helps. Yes, of course it does. I need you to pay attention to grammar, sentence structures. You could get an incredibly high score just by knowing these following structures. **EFFECTIVE SENTENCE STRUCTURES TO GET AN 8.0+** **1. Position statement:** * The price of gas stood at $2.75 per gallon. * In 2005, the sugar export accounted for about 10% of total exports. **2. Movement statements** * There was a decrease in the price of gas/ gas prices. * There was an increase in the sugar export/ export of sugar/ exported sugar. * Gas prices/ the price of gas decreased. * The export of sugar/ the sugar export/ the exported sugar increased. * Gas prices/ the price of gas experienced a decrease. * The export of sugar/ the sugar export/ the exported sugar witnessed an increase. **3. Time phrases** * From 1990 to 1995 * Between 1990 and 1995 * During/throughout the period from 1995 to 2005 * During a period of 10 years * Over the (three-month) period (between April and June) * In 1990 * By 1995 * For 5 years **4. Grammar variations** Connecting sentences together makes your writing more interesting and can help to improve your band score – but you should aim to vary the way you link sentences. Here are a couple of options to try instead of just using “then”: **5. Vocabulary variations** Again, these variations increase the range of language you use, which can make your writing more interesting and benefit your band score. * There was a slight fall in CD sales in 2010. * (The year) 2010 saw a slight fall in CD sales. * CD sales experienced a slight fall in 2010. **6. Giving evidence (data)** When you describe the key information in a diagram, it’s extremely important to include evidence to support your idea. This means you add data: specific numbers, percentages, etc. For example: * CD sales increased slightly from 52 (million) to 70 million units between 2009 and 2010. * CD sales increased slightly from 52 million in 2010 to 70 million the following year. * CD sales increased by eight million units from 2009 to 2010. * During the period 1990 to 1995, there was a decrease in gas prices from $2.70 to $2.75 per gallon. * There was an increase in the sugar export between May and August from about 10% to over 20%. * Between 1990 and 1995, the price of gas decreased from $2.75 to $2.70 per gallon. * The sugar export increased from approximately 10% to more than 20% between May and August. * From 1990 to 1995, the price of gas experienced a decrease from $2.75 to $2.70 per gallon.
**If we have 2 time points** (that could be days/weeks/months/years/decades), we need to use **trend language**. We need to talk about “increase”, “decrease”. We could talk about 1990 and 2000, or we could talk about January and June, or we could talk about Monday and Friday. It doesn’t matter. **Note:** if they give you a diagram with **just one year**, all we can do is just to **compare**, we **cannot** use trend language “increase”, “decrease”, “fluctuated”. In other words, we **cannot** talk about movement. On the other hand, if they give you **two years**, **three years**, or **four years**, they **still want comparison**, but **now they also want** **trend language**. They also want you to talk about movement. These are really two basic groups of language that you need to use to describe diagrams: **comparison** and **trend language**. Let’s build some vocabulary. Here is a **list of verbs, adverbs, adjectives and nouns** that you need to use in task 1 writing. — **TASK 1 WRITING PROCESS TO MAXIMIZE SCORE** **1. Read Summary:** What they will be giving you in task 1 writing is they will give you a diagram with a description. This description is called a **summary**. The summary is used to tell you what you are looking at, and it will tell you exactly that, so you **must read the summary carefully before writing**. Example: “The table below shows how many tourists from five countries visiting Australia in different years from 1991 and 1999.” When you look at the diagram, the first step should be asking yourself * What’s the verb tense? Or what are the verb tenses? (Past tense) * Look at the summary, look at the diagram and ask yourself * What is measured? (the number of tourists) * Unit of Measurement? (thousand) We need to be accurate about what is being measured and the unit of measurement. **2. Analyze Trends:** * Look at the general trend. It’s quite easy. You simply look **from the beginning to the end**. You don’t need to worry about the middle. You only should look at the beginning and the end (did it increase?, did it remain the same?, or did it decrease?). * After looking at the general trend, you should look at a couple of the other things. First of all if you see any **peaks, any dips**, any fluctuations, anything is going in the middle between the beginning and the end. * **Superlatives** (highest, least, most, fewest). For example, which country accounted for the most or and which country accounted for the fewest visitors? **3. What are the main points?** The main points are the **most important features** (the most important trends, **some general comparisons** and **some**


